投身Matplotlib和放弃Matplotlib的理由可能是一样的:Matplotlib强大而灵活。在学习Matplotlib的时候,初学者容易遭遇Jun所描述的认知障碍。本帖面向初学者解析Matpltolib的基本概念。
matplotlib.pyplot vs Axes
Matplotlib的官方教程中指出了Matplotlib具有两种界面:显式和隐式界面。
- 显式:即用
axes.Axes用例在figure.Figure上建立视图。 - 隐式:即采用类MATLAB的方式,通过一个全局状态基界面,封装了
pyplot模式绘制当前子图。
教程提醒我们:
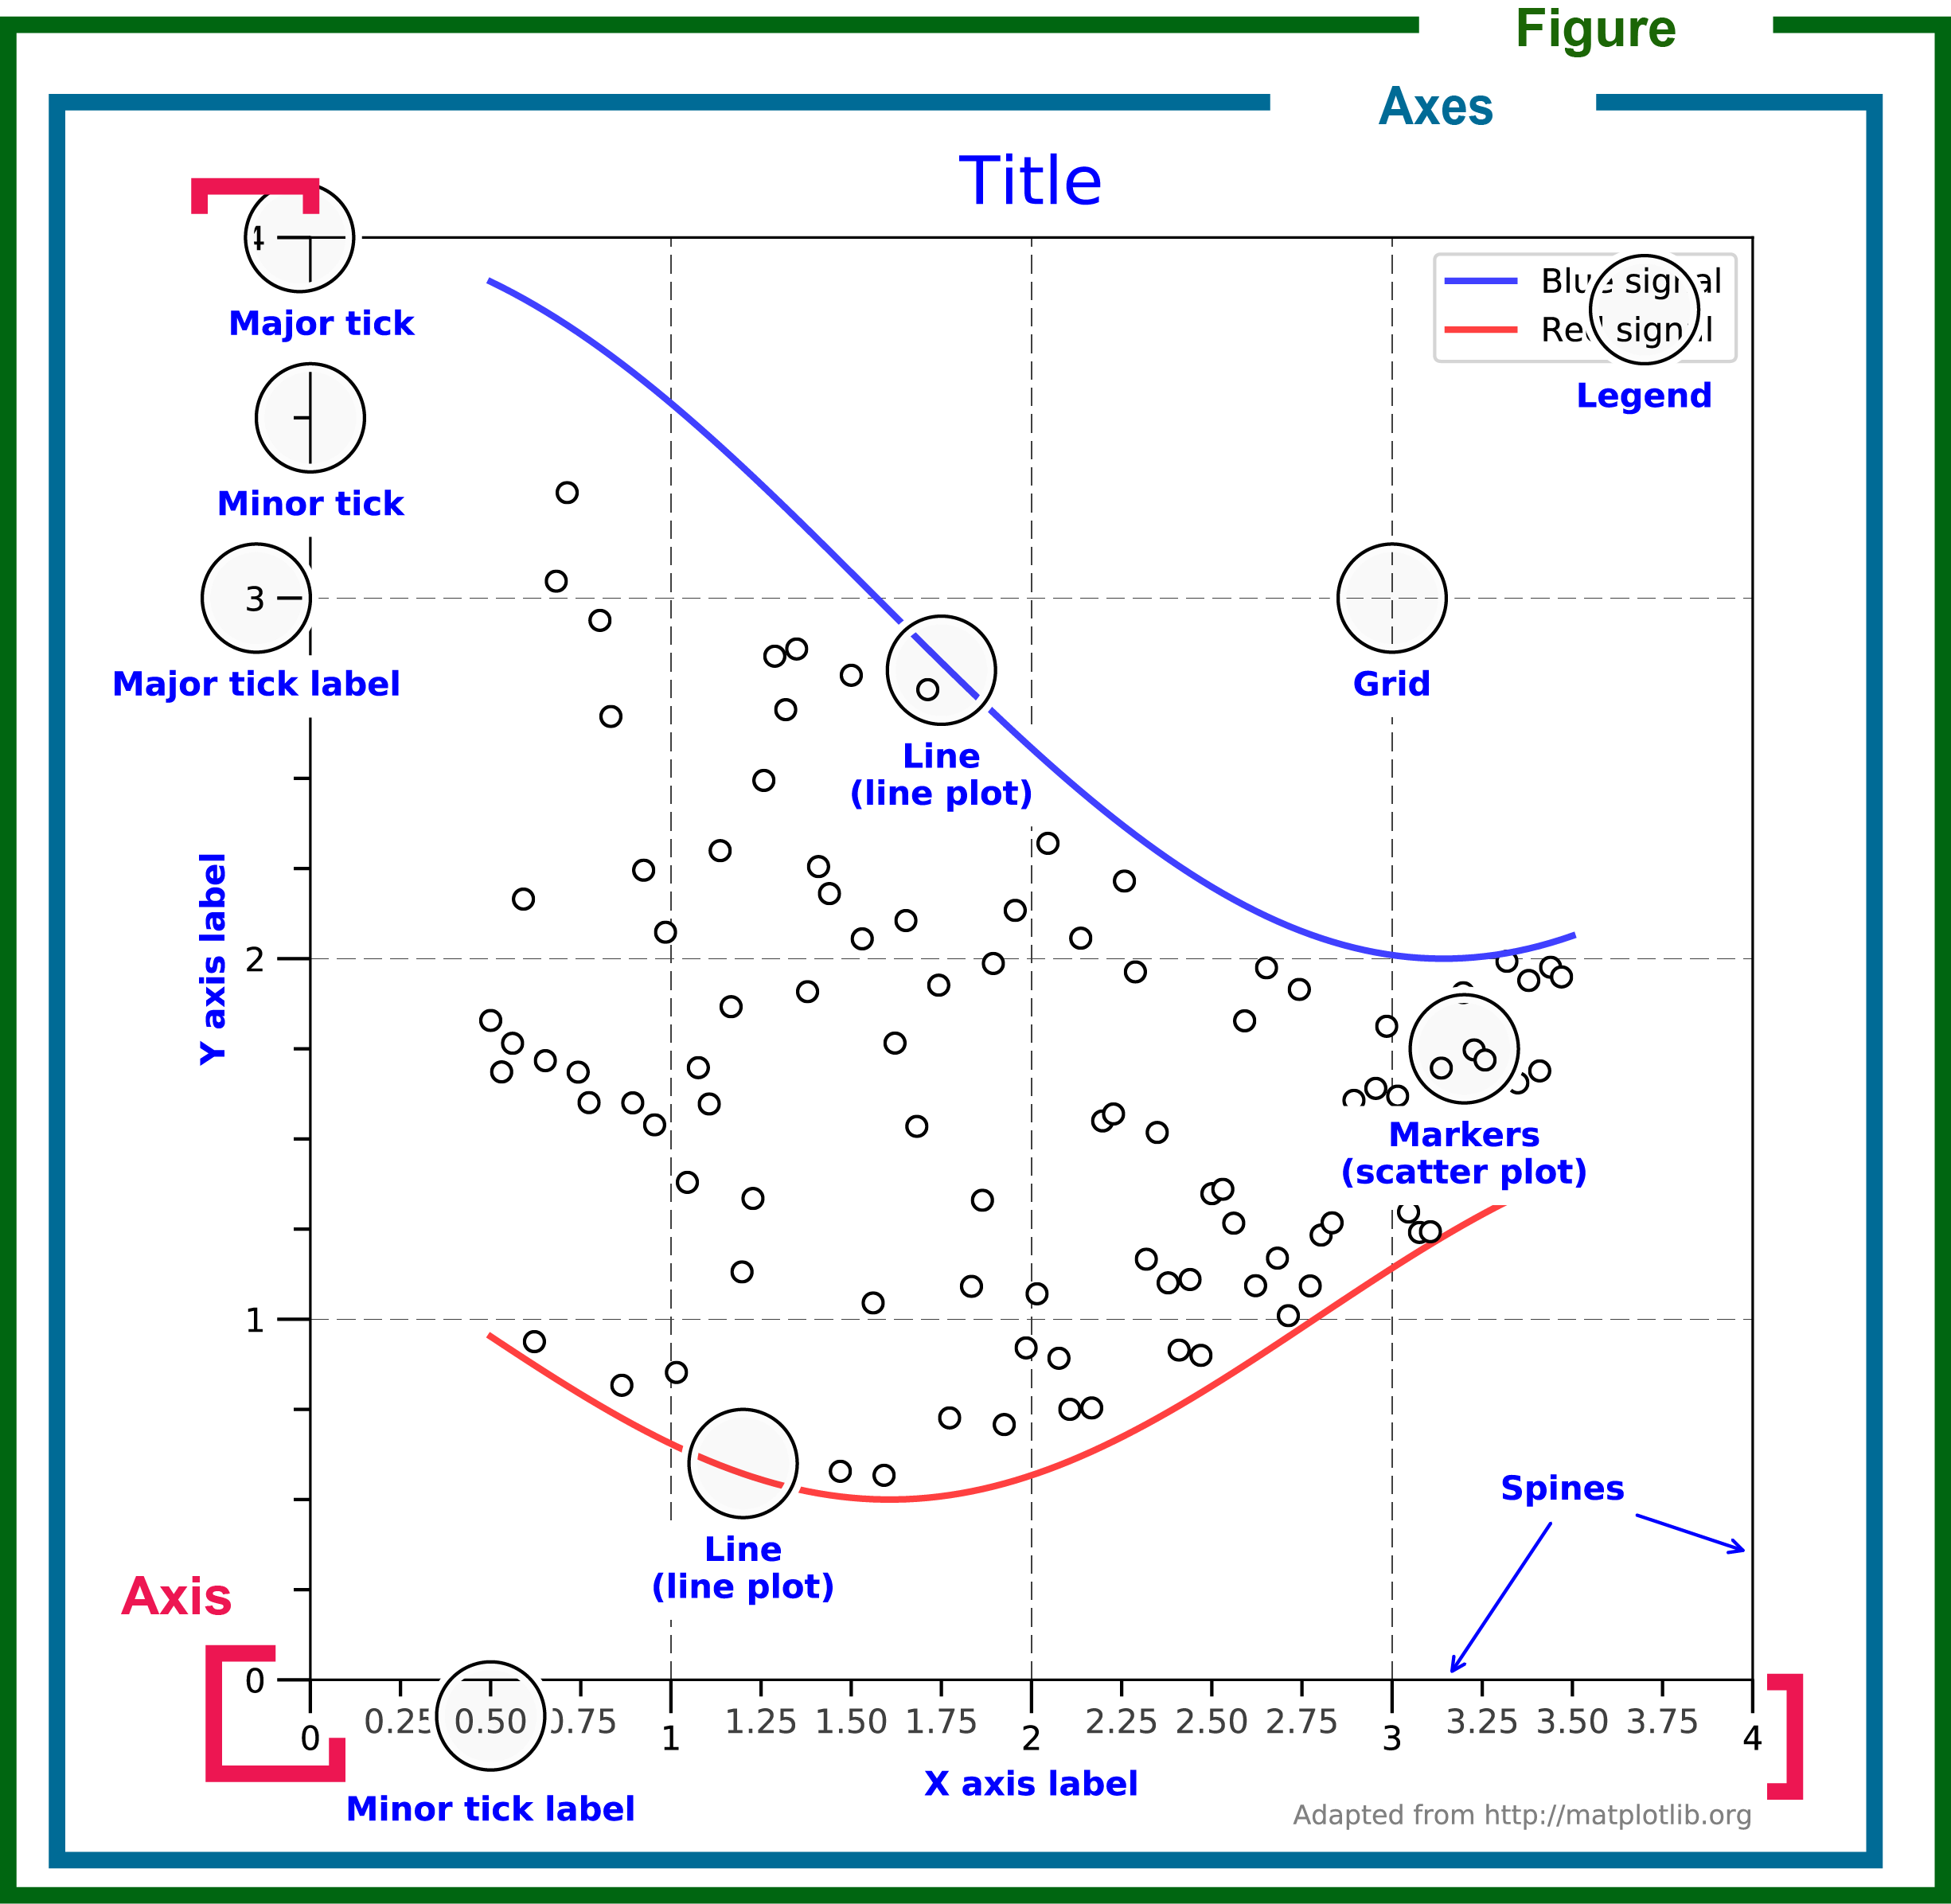
The Figure is the final image that may contain 1 or more Axes.
Figure是一个容器,承载一个或多个Aexes。The Axes represent an individual plot (don’t confuse this with the word “axis”, which refers to the x/y axis of a plot).
Axes代表一个单独的图(不可和单词axis混淆,axis指的是x/y轴)。注意,单从语法上而言,axes确实是axis的复数形式。但在Matplotlib中,Axes类用例作为一个图承载的是从多Artists类用例,其中就包括Axis作标轴。
matplotlib.pyplot
matplotlib.pyplotis a state-based interface to matplotlib. It provides an implicit, MATLAB-like, way of plotting. It also opens figures on your screen, and acts as the figure GUI manager.
matplotlib.pyplot(简称plt)是Matplotlib的状态基界面。它提供了一个类MATLIB的隐式绘图方式。它还能在屏幕上打开图,行为类同图的GUI管理器。
- 注意,它是界面类,不会有用例。你不会看到
plt()这样的语法。 - 可以通过
plt.plot(x, y)生成图。这种方式是所谓类MATLAB、或过程风格的绘图。 - 调用
plt的方法,可生成图matplotlib.figure、子图 matplotlib.axes等:fig, ax = plt.subplots() - 再基于matplotlib.axes的方法即可实现所谓OO风格的绘图。
ax.plot(x, y)
Axes
Axes is the most basic and flexible unit for creating sub-plots.
Axes是生成子图的最基本、最灵活的容器类。Axes用例就是一个容器,承载坐标轴、线、点、图例等元素,这些元素有一个共同的基类:Artist。它们之间的关系和用法见后文。
- plt.xxx和ax.xxx的区别
- plt.xxx采用了类MATLAB风格绘图,适合初学者使用,且适用于快速分析数据的场景,但当任务较为复杂时代码就不宜阅读了;
- ax.xxx采用OO风格绘图,条理清晰,便于维护,适用于软件开发场景。
参考
生成图片的众多方式
和绘图类类比,figure就是一块画布,而axes就是画布的艺术作品。一块画布上可有一类或多类艺术作品。由此,我们首先从一块画布仅有一幅作品开始,然后再实现一块画布上有多幅作品的场景。
figure上仅有一个axes
fig.add_subplot()
# 先初始化一个figure用例。
fig = plt.figure(…)
#  再在这个figure上生成一个axes用例。
ax = fig.add_subplot()
- 当用空括号时,表明采用了默认参数,即
fig.add_subplot(1,1,1)表示增加了一个1号axes,在1行1列的网格上。也可以用没有逗号隔开的主式:fig.add_subplot(111)。注意,在这种三整数格式中,每个整数都不能大于9。
fig.add_subplots()
有时也会用到ax = fig.subplots()的方式添加一个axes。这是在批量生成一组子图布局时仅生成一个子图的表达方式,相当于调用了默认参数,即ax = fig.subplots(1,1),即1行1列的情形。
ax = fig.add_axes([left, bottom, width, height])
这是在figure上生成一个子图,并定义了其位置和大小。参数均为figure宽度和高度的小数。fig.add_axes([0, 0, 0.78, 0.78])等同于fig.add_subplot(111)或fig.subplots(1, 1)。显然,axes尺寸并不等同于figure。在两者之间有默认的空白。
plt.subplot()、plt.subplots()、plt.axes()
这些函数都是matplotlib的状态基界面,即脚本层绘图,分别包装了fig = plt.figure()之后的fig.add_subplot(),fig.subplots(),以及fig.add_axes()。
-
plt.subplot()返回了一个axes和自动生成的figure;# Creates just a figure and only one subplot ax = plt.subplot() # Equivalent method fig = plt.figure() ax = fig.add_subplot(1, 1, 1)-
可由
ax.figure.xxx()改变figure层的属性。如ax.figure.savefig('example.png')将figure存为example.png。 -
plt.subplots()返回一个元组,包含一个figure和一个或一组axes对象。我们需要将该元组解包,并分别赋予fig和ax。# Set one # Creates just a figure and only one subplot fig, ax = plt.subplots() # Equivalent method fig = plt.figure() ax = fig.subplots(1, 1) -
plt.axes()返回一个axes,和plt.subplot()一样。它同fig.add_axes([left, bottom, width, height])一样接受位置和大小参数。# Set one # Creates just a figure and only one subplot ax = plt.axes() # Equivalent method fig = plt.figure() ax = fig.add_subplot(1, 1, 1) ------------------------------------------- # Set two # Creates just a figure and only one subplot ax = plt.axes([0, 0, 0.78, 0.78]) # Equivalent method fig = plt.figure() ax = fig.add_axes([0, 0, 0.78, 0.78])
-
figure上有多个axes
fig.add_subplot()
fig = plt.figure()
ax1 = fig.add_subplot(221)
ax2 = fig.add_subplot(222)
ax3 = fig.add_subplot(223)
ax4 = fig.add_subplot(224)
ax1.annotate('I am ax1', (0.5, 0.5), xycoords='axes fraction', va= 'center', ha='center')
ax2.annotate('I am ax2', (0.5, 0.5), xycoords='axes fraction', va= 'center', ha='center')
ax3.annotate('I am ax3', (0.5, 0.5), xycoords='axes fraction', va= 'center', ha='center')
ax4.annotate('I am ax4', (0.5, 0.5), xycoords='axes fraction', va= 'center', ha='center')
plt.tight_layout()
fig.add_subplots()
fig = plt.figure()
axs = fig.add_subplots(nrows=2, ncols=2)
axs.flat[0].annotate('I am ax1', (0.5, 0.5), xycoords='axes fraction', va= 'center', ha='center')
axs.flat[1].annotate('I am ax2', (0.5, 0.5), xycoords='axes fraction', va= 'center', ha='center')
axs.flat[2].annotate('I am ax3', (0.5, 0.5), xycoords='axes fraction', va= 'center', ha='center')
axs.flat[3].annotate('I am ax4', (0.5, 0.5), xycoords='axes fraction', va= 'center', ha='center')
plt.tight_layout()
fig.axes()
通常,fig.axes()用于任意布局,这样的布局允许子图包含子图,或子图重叠子图。
fig = plt.figure()
ax1 = fig.add_axes([0, 0.6, 0.5, 0.5])
ax2 = fig.add_axes([0.6, 0.6, 0.5, 0.5])
ax3 = fig.add_axes([0, 0, 0.5, 0.5])
ax4 = fig.add_axes([0.6, 0, 0.5, 0.5])
plt.show()
以上述OO风格的绘图方法之外,还可以用脚本层包装方法与之对应,包括:plt.add_subplot(),plt.add_subplots(),plt.axes()。用法基本相同,这里不再重复代码。